

Xdebugのインストール
phpは事前にhomebrewでインストールしておく。
以前はXdebugもhomebrewでインストール可能だったが、現在は非推奨になっているためリポジトリ自体が消えている。代わりにPECLを使って入れる。
# peclの参照がhomebrewで入れたphpのバージョンに沿っているか確認
# シンボリックリンクで参照先が /Cellar/php/[バージョン] 配下になっていれば大丈夫

$ which pecl
$ pecl install xdebug

# 成功すると以下内容が出力される

#      INSTALLATION INSTRUCTIONS                                          |
#  |   =========================                                          |
#  |                                                                      |
#  |   See https://xdebug.org/install.php#configure-php for instructions  |
#  |   on how to enable Xdebug for PHP.                                   |
#  |                                                                      |
#  |   Documentation is available online as well:                         |
#  |   - A list of all settings:  https://xdebug.org/docs-settings.php    |
#  |   - A list of all functions: https://xdebug.org/docs-functions.php   |
#  |   - Profiling instructions:  https://xdebug.org/docs-profiling2.php  |
#  |   - Remote debugging:        https://xdebug.org/docs-debugger.php    |
#  |                                                                      |
#  |                                                                      |
#  |   NOTE: Please disregard the message                                 |
#  |       You should add "extension=xdebug.so" to php.ini                |
#  |   that is emitted by the PECL installer. This does not work for      |
#  |   Xdebug.
php.ini の設定
php --ini でパスを調べることができる。
$ php --ini
$ vi /path/to/php.ini
php.ini
# 以下を追記
[xdebug]
zend_extension="xdebug.so"
xdebug.remote_enable=1
xdebug.idekey="PHPSTORM"

# 以下はデフォルト値(書かなくてもいい)
;xdebug.remote_port=9000
;xdebug.remote_host=localhost
;xdebug.remote_connect_back=0
;xdebug.remote_autostart=0
;xdebug.remote_cookie_expire_time=3600
;xdebug.remote_mode=reqリモートとは、PHPが動作するサーバから見たホストを指すため注意。ローカル環境ならPHPが動作するサーバもデバッグを制御するリモートホストも同じ。
[PHP] Xdebug のリモートデバッグ、理解していますか? – Qiita
PhpStorm の設定
Preferences > PHPを開き、CLI Interpreter に homebrew でインストールしたPHPのパスを指定する- Browser Debugging Extensions – Help | PhpStorm から各ブラウザに応じた拡張機能を入れておく
- PhpStorm側でデバッグlistening状態にする(ツールバーの電話マーク)
- ブラウザを起動し、2でインストールした拡張機能を有効化
- 任意の箇所にbreakpoint設置してデバッグできればOK
設定の補足
xdebug.remote_autostart=1にするとブラウザの拡張機能は意味がない(OFFでも動作する)xdebug.remote_autostart=0の場合は?XDEBUG_SESSION_START=任意の名称をクエリストリングで渡すことを契機にデバッグセッションが開始される- つまりブラウザの拡張機能はQueryStringの制御をしているに過ぎない
- php.ini を書き換えた際にWebサーバの再起動が必要なので忘れずに(Laravel Valet を使っているなら
valet restart)
トラブルシューティング
デバッグ処理が複数走ってしまう
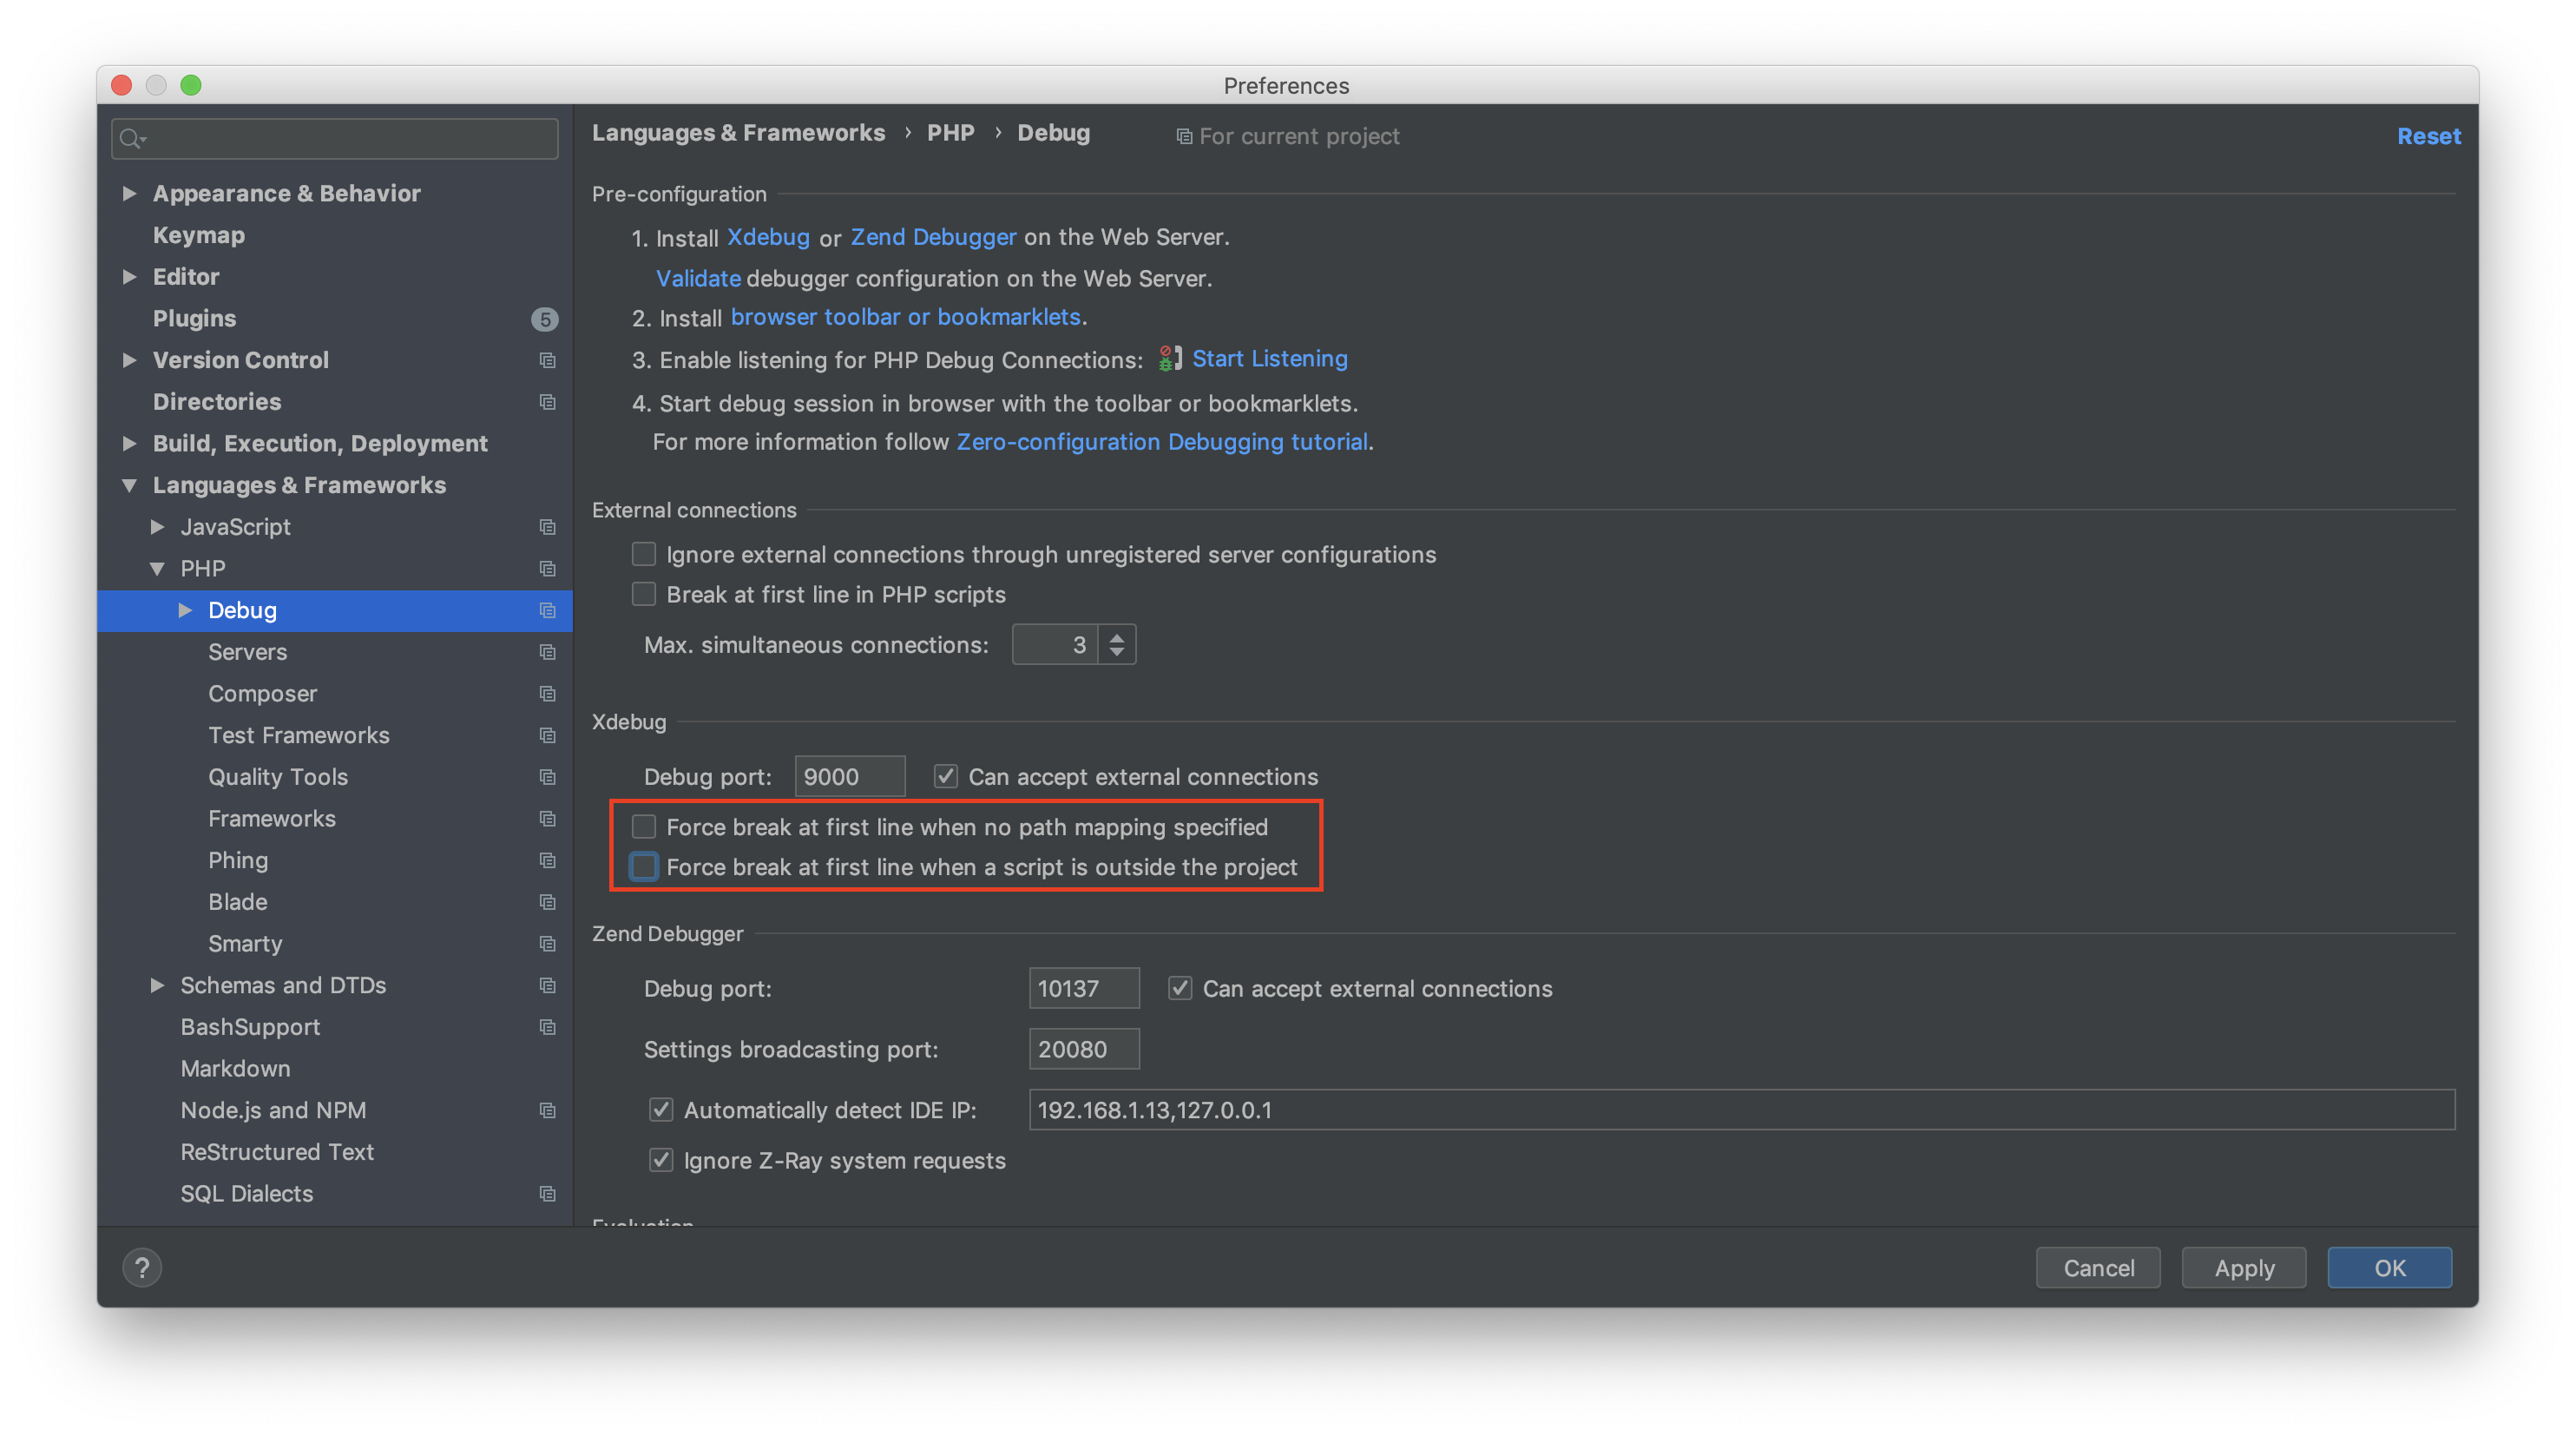
Languages & Frameworks > PHP > Debug の「Force break at first line when a script is outside the project」(プロジェクト外のスクリプトが走った時に強制で1行目break)にチェックが入っている場合に再現する。
例えば、Laravel Valet でアプリケーションを3つ動かしている場合、/Users/yourname/.composer/vendor/laravel/valet/server.php がそれぞれのアプリケーションをハンドリングしているため、関係ない2本のデバッグが走ってしまう。
強制的にbreakされるのが原因なので、Preferences > PHP > Debug から以下2点のチェックを外しておけば解決する。
- Force break at first line when no path mapping specified
- Force break at first line when a script is outside the project
POSTMANでデバッグしたい
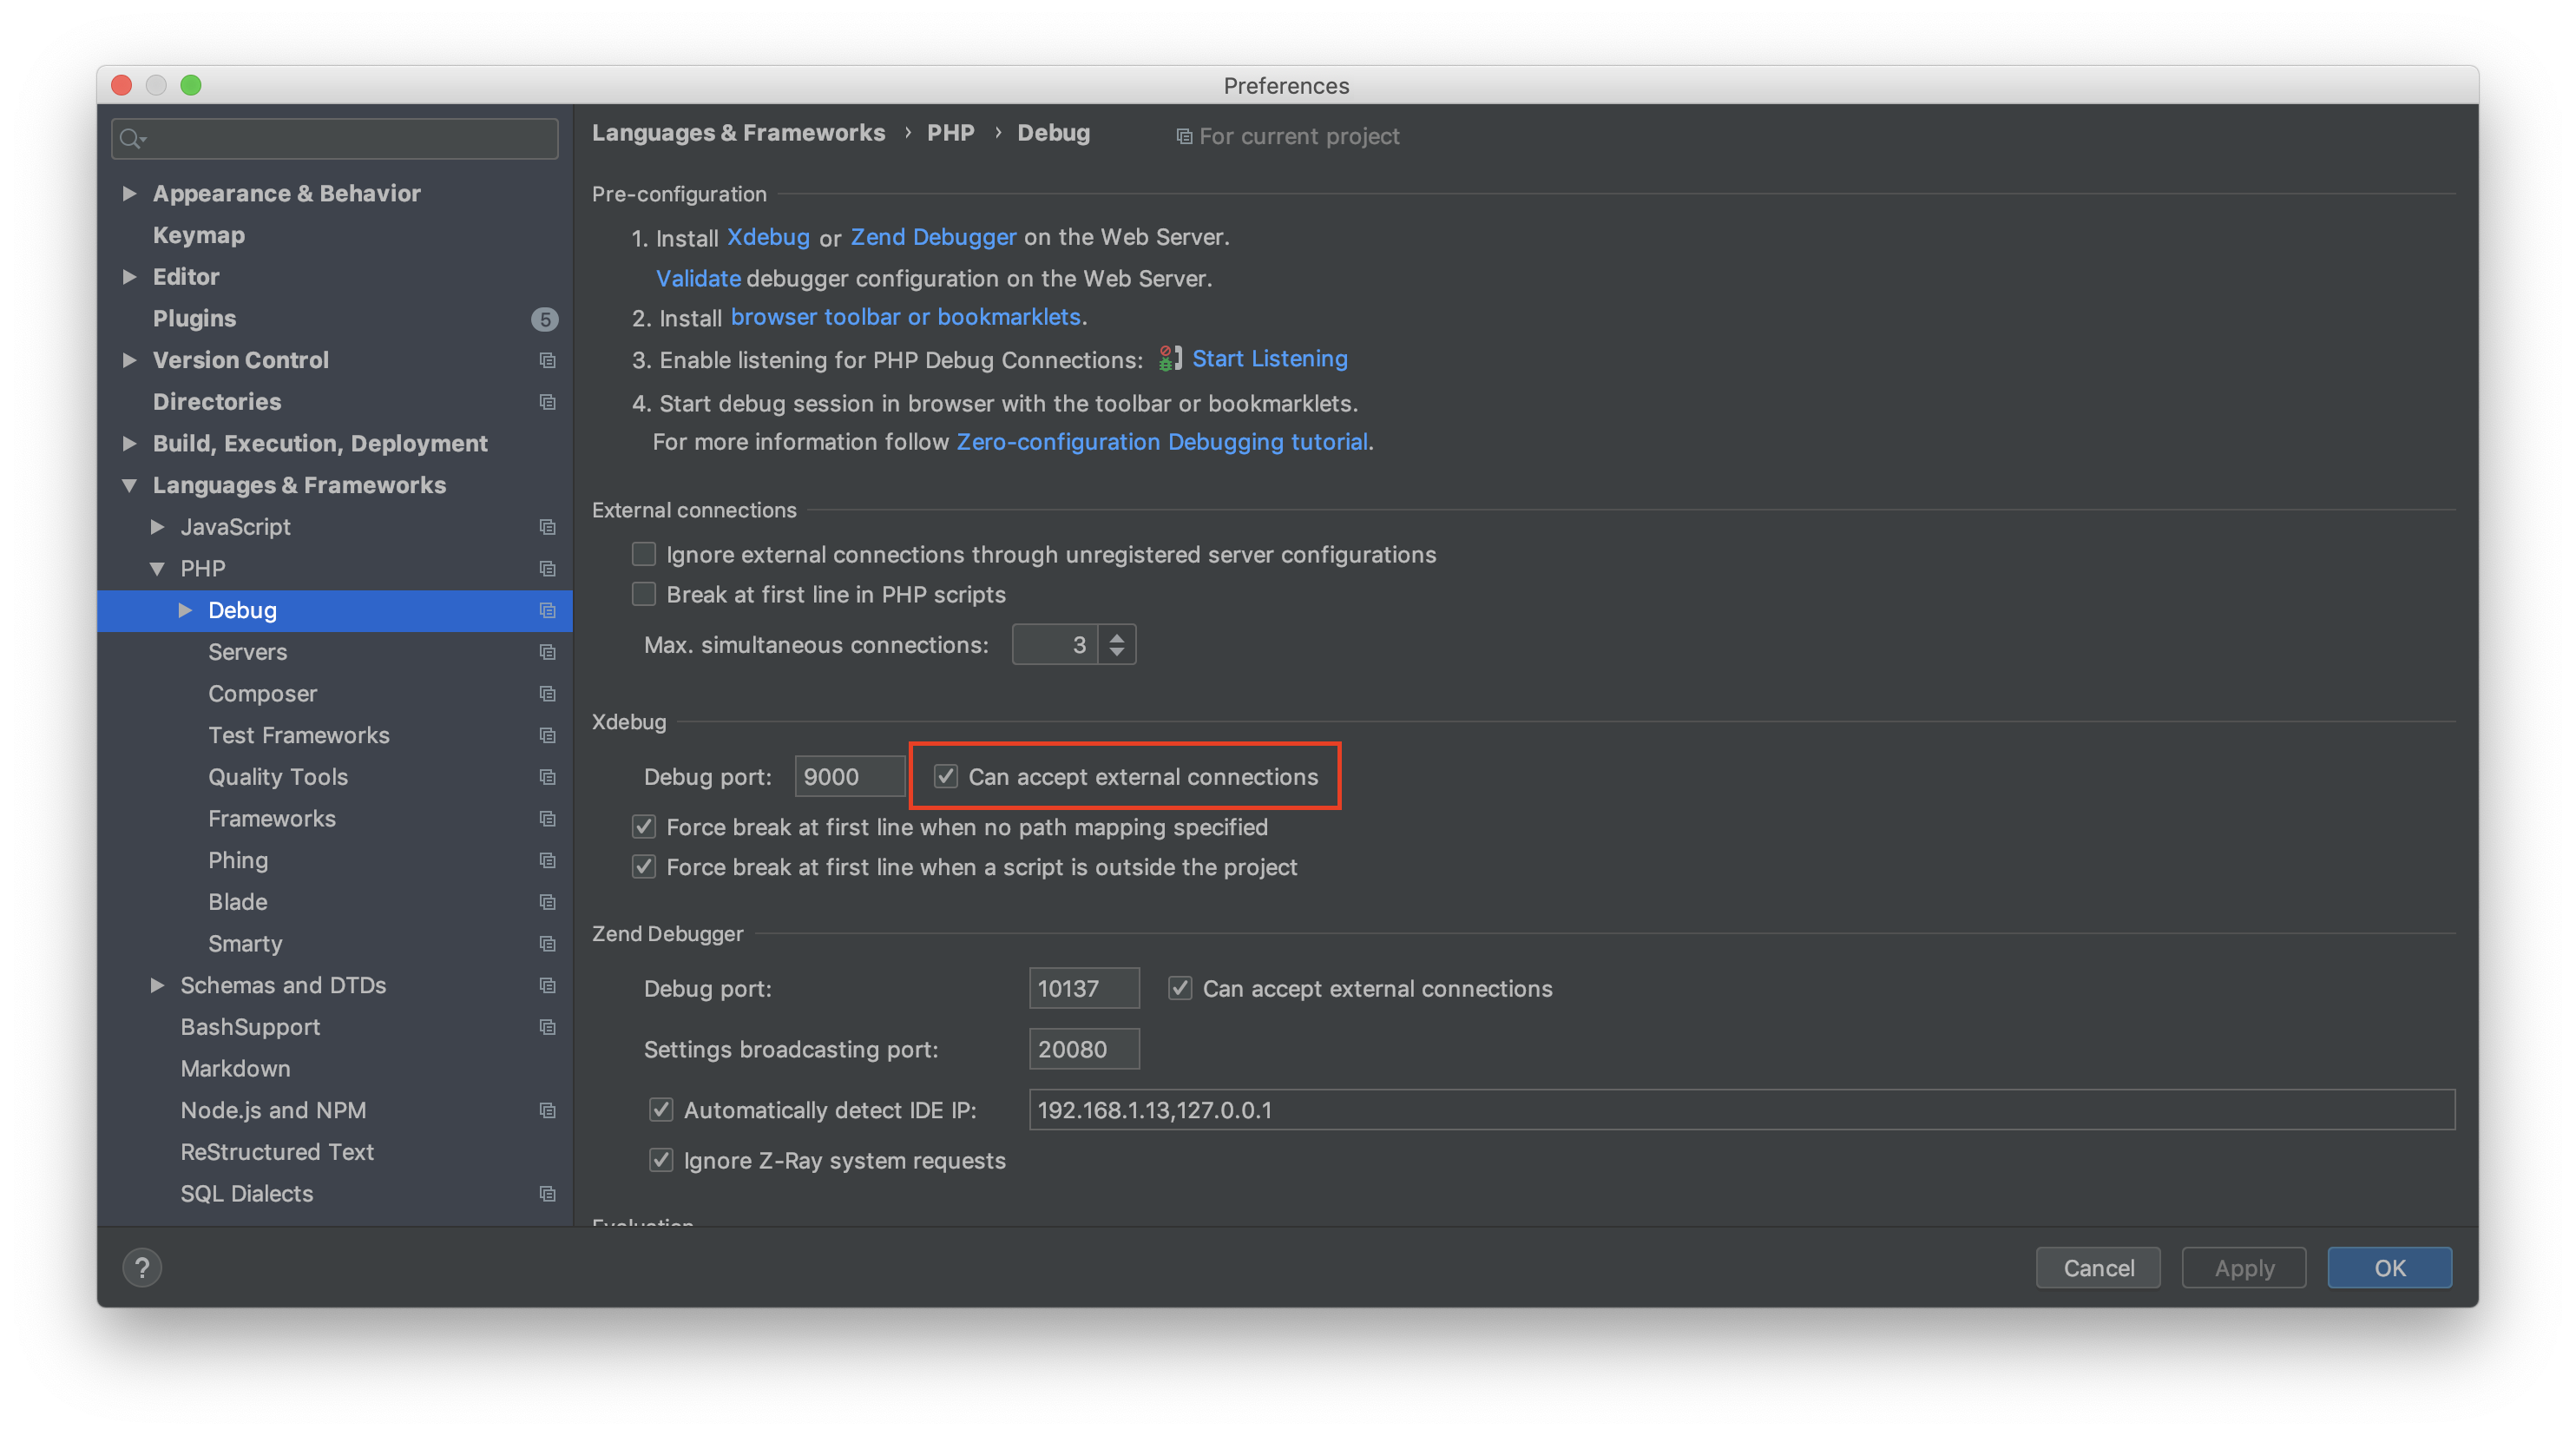
xdebug.remote_autostart=1 にするか ?XDEBUG_SESSION_START=PHPSTORM をエンドポイントに付与する。
また、PhpStorm側のLanguages & Frameworks > PHP > Debugから「Can accept external connections」にチェックを入れる。
リモートサーバのアプリケーションをデバッグしたい
PhpStormによるデバッグ: 基本ガイド – ヘルプ | PhpStorm に記載があるように、リモートサーバ(VPSなど)でXdebugを動かしている場合はSSHトンネリング経由でデバッグを行うことになる。